Session 5 - The environmental footprint of the digital sector
This session parlty uses the research paper from Gauthier Roussilhe, Anne-Laure Ligozat and Sophie Quinton, titled: A long road ahead: a review of the state of knowledge of the environmental effects of digitization (2023) (Link)
A key difference
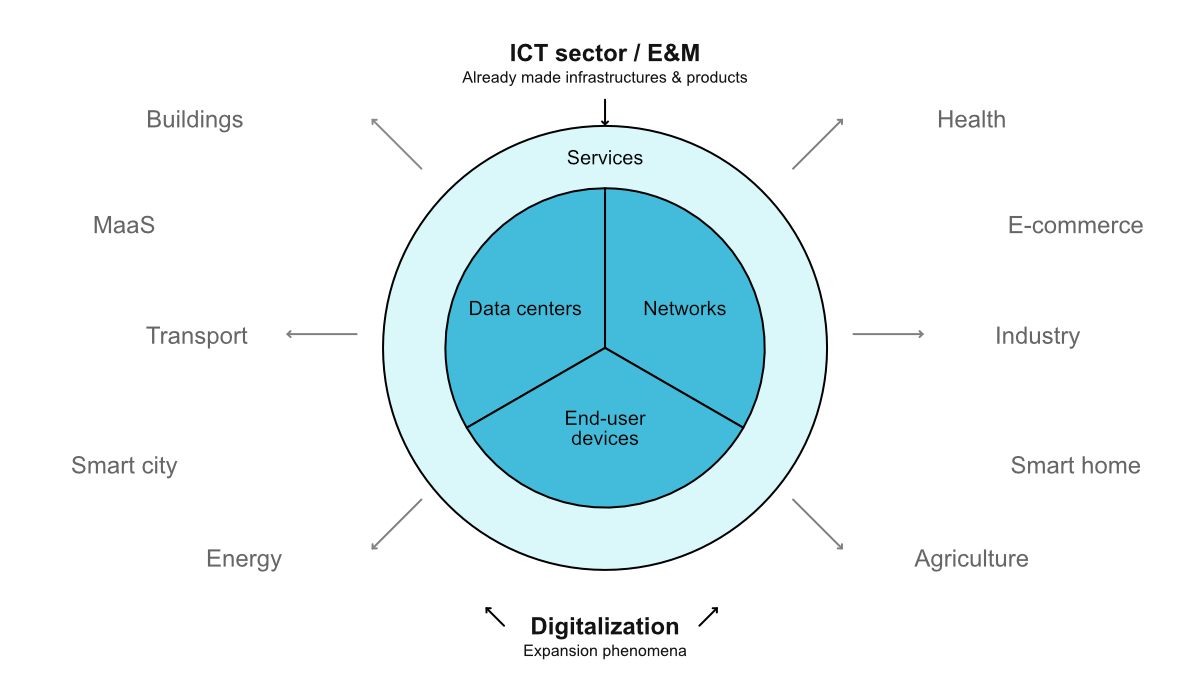
For the purpose of environmental analysis of the digital sector, it is customary to divide it into three technical parts: data centers, networks and user equipment. In addition, there is a services perimeter: with a few exceptions, any digital service needs data centers, telecommunication networks and IT equipment to function. Separately, we look at other sectors (transport, energy, industry, etc.) to estimate the indirect effects of digitization (rebound effect, substitution, etc. leading to avoided or added impacts) without really imposing an official method. .
What is an environmental footprint?
This part parlty uses the blogpost from David Ekchajzer titled : Counting environmental impacts using attributional and consequential approaches (2024) (Link)
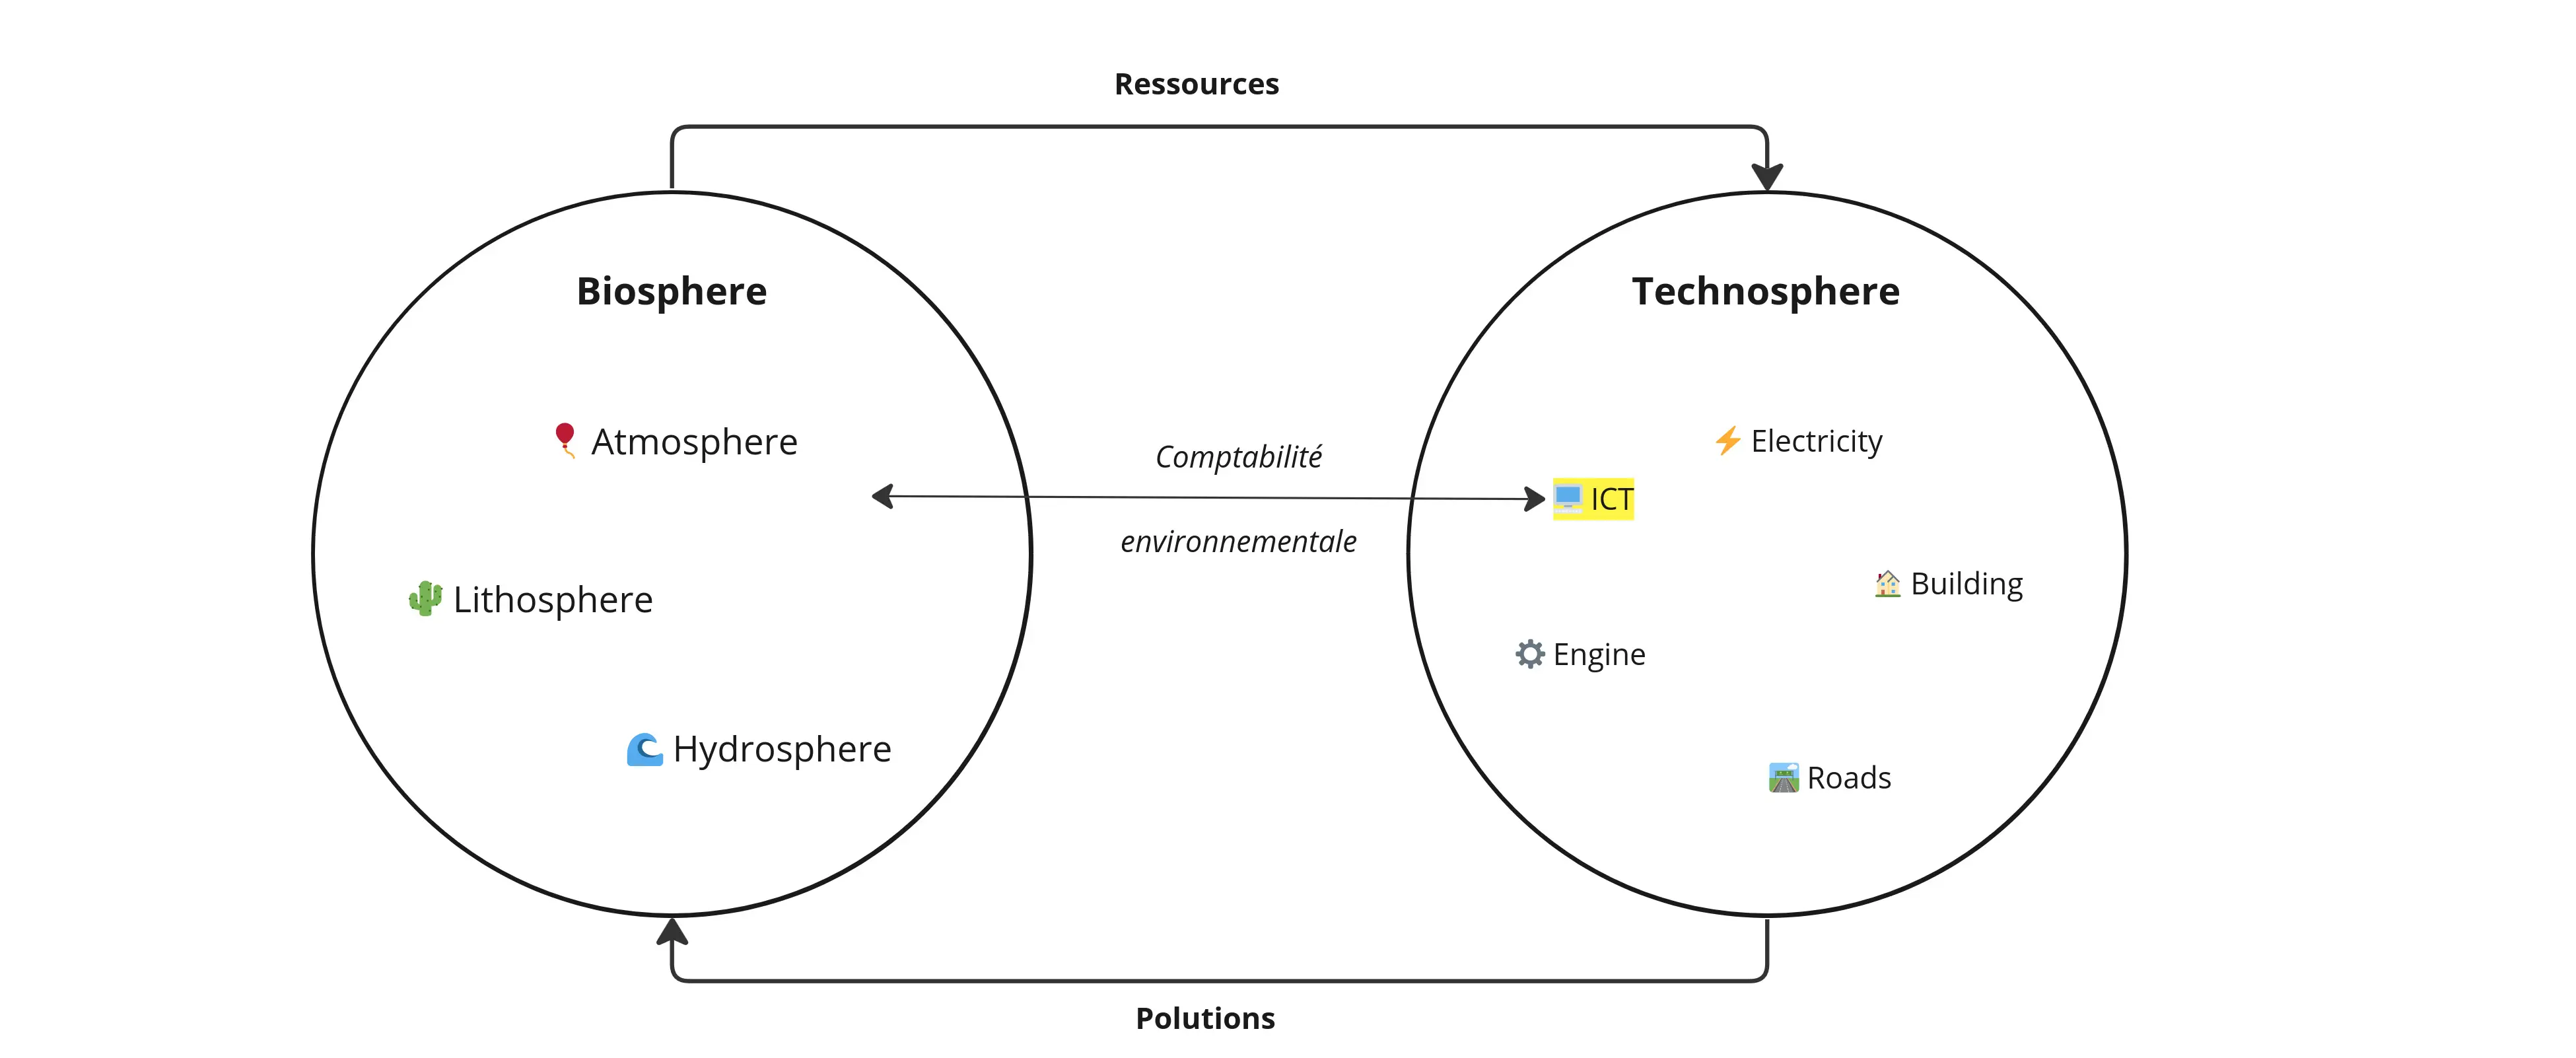
Environmental impacts are physical phenomena taking place within the biosphere. They can be localized to particular areas (land use, air pollution, etc.) or global (contribution to global warming, depletion of abiotic resources, etc.). These environmental impacts can be assessed using physical measuring instruments (with a carbon dioxide sensor, for example). This is the case for soil, air or water pollution, when directly measured on ecosystems. These impact measurements enable us to understand past and present environmental and physical constraints.
However, by characterizing only phenomena that take place inside the biosphere, they make it difficult to manage consumption, production or public policies, which are socio-economic phenomena that take place within the technosphere.
The biosphere corresponds to all terrestrial ecosystems present on the lithosphere (earth), atmosphere (air) and hydrosphere (sea). The technosphere corresponds to the part of the biosphere modified by human activities.
This is where environmental accounting comes in. It makes it possible to match socio-economic realities (a product, a service, a unit of currency, an action, a policy, etc.) with a physical materiality characterized by environmental impacts.
This materiality is expressed in physical units: kgCO2eq. for contribution to global warming, m3 for water depletion or kg for land transformation (see PEF1). This suggests that the values produced by environmental accounting are of the same nature as those produced by physical measuring instruments such as a CO2 sensor, a graduated container to evaluate m3 or a weighing scale to evaluate kg.
However, when used in the context of environmental accounting, these units are intended to describe not only physical realities, but also socio-economic ones. Indeed, associating environmental impacts with socio-economic realities is not a neutral approach, but rather one of accounting that follows established technical rules that are part of modeling paradigms (logical and political principles). It is these principles that define the way in which human activities in the technosphere and environmental impacts in the biosphere are linked.
Environmental footprint in the digital sector
In environmental studies, the digital sector is divided into three areas: data centres, telecommunications networks and user equipment. This division is now the consensus of the scientific community and also meets the modelling objectives of international standards for studying the life cycle of a system, a service or a product. These standards are ISO 14040 and 140441 and specifically the ITU L.1410 standard (ETSI 203 199) developed in part by the industry.
Describing all the environmental impacts related to the production of digital infrastructure (manufacture of servers, antennas, equipment, etc.), its use and its end of life, is a complex exercise that varies greatly depending on the equipment, the production methods and the territories concerned. This description of impacts can only be accurate if it focuses on equipment production and use at an explicitly defined scale. For example, what are the environmental impacts associated with the production, use and end-of-life of a smartphone?
The digital infrastructure has multiple impacts on ecosystems: use of fresh water, extraction of minerals in fragile ecosystems, soil pollution, landfill pollution from equipment, greenhouse gas emissions, etc. One indicator in particular is attracting attention today because it corresponds to the transition objectives set by national and international institutions: greenhouse gas emissions. These gases are generally emitted in the production of IT equipment (fuel oil for extraction and transport, energy to run industrial production lines, foundries, etc.) and in the production of the energy needed to run this equipment (electricity production). Greenhouse gas emissions are therefore directly related to the energy consumption of the digital infrastructure, i.e. the manufacture and use of equipment. However, despite the focus on greenhouse gas emissions and thus energy consumption, other major impacts of digital infrastructure should not be overlooked: consumption of metals and other associated resources, water consumption, ecosystem degradation and pollution. In order to have the clearest possible picture of the environmental footprint of digital technology, it is necessary to use all these criteria and to study them with a globally shared methodology. That's the purpose of a life cycle assessment (LCA).
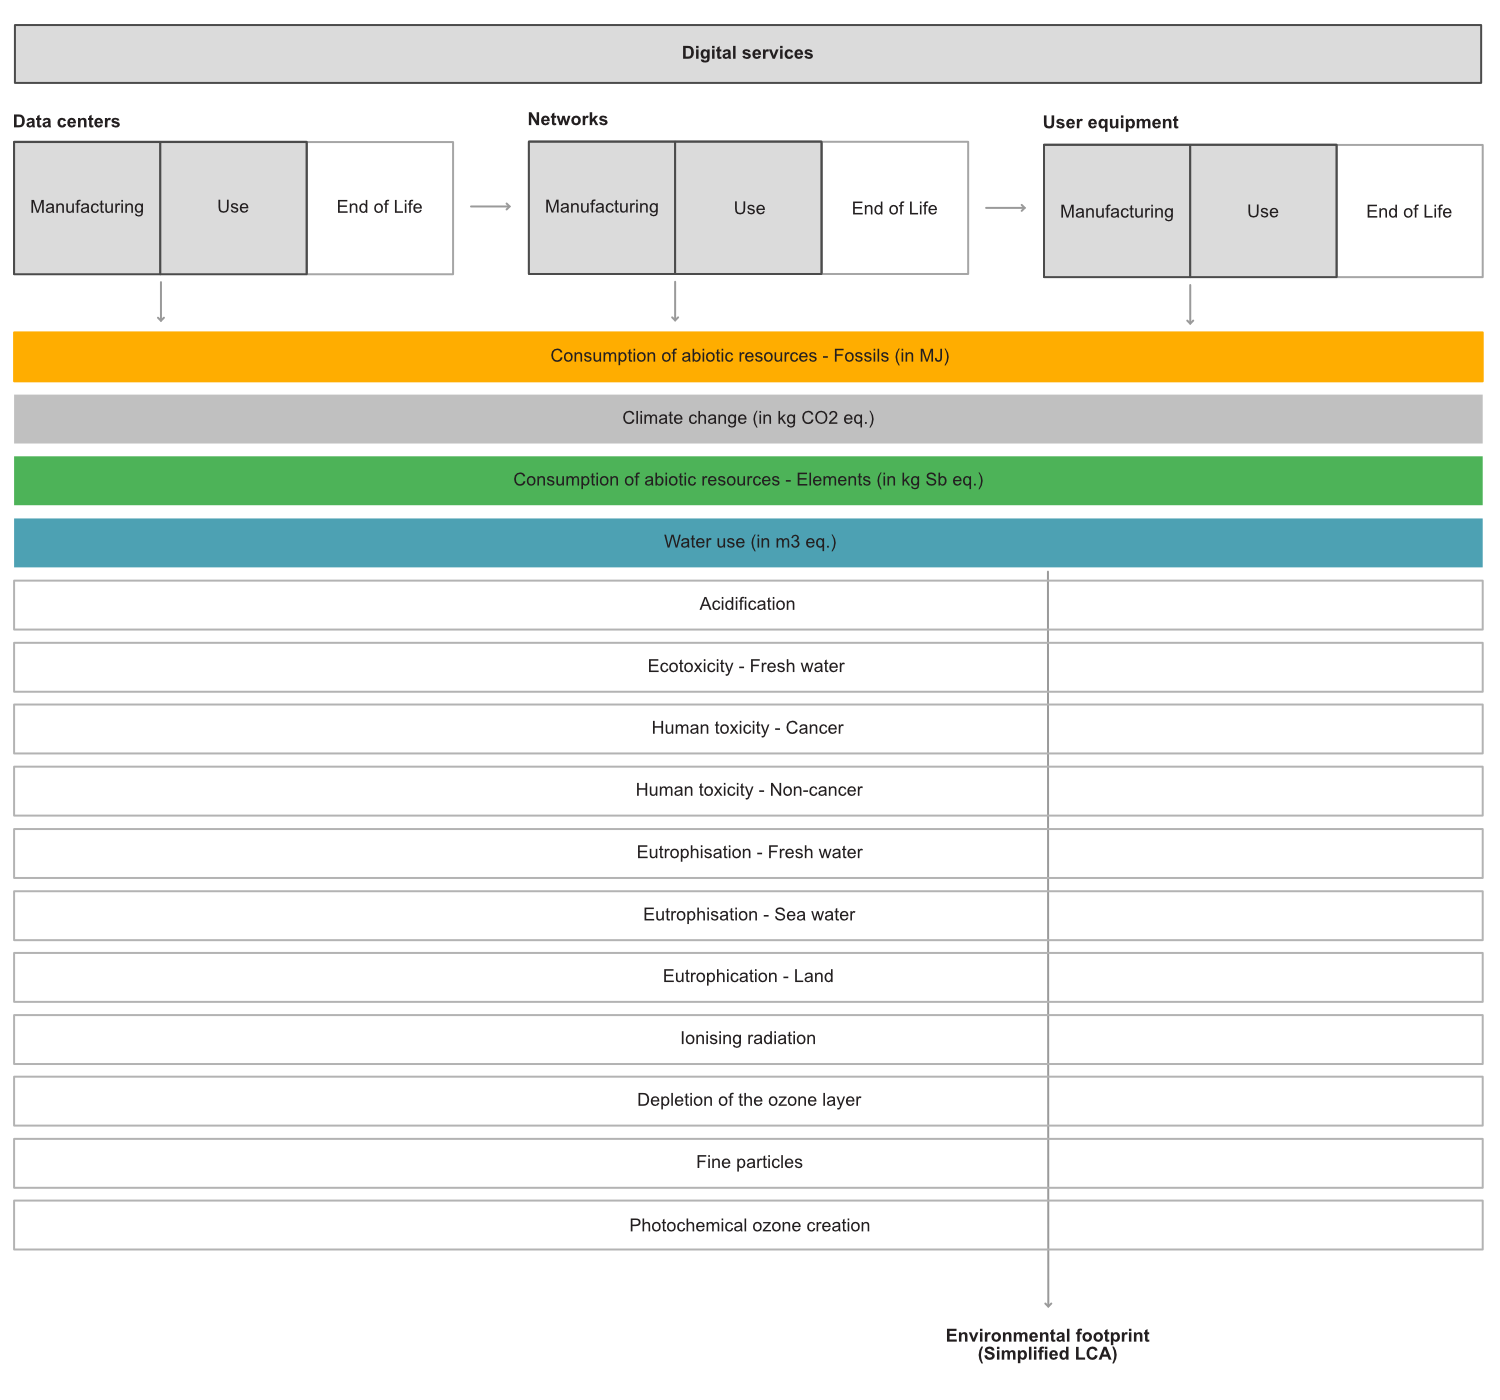
Environmental footprint of a simplified LCA for a digital service
Today, we have relatively little data on the entire life cycle of digital products and infrastructure, especially on manufacturing and end-of-life. In fact, the environmental footprint is limited to four environmental factors, whereas the European Union recommends 20 in its environmental analysis standards.
Let us take a look at current practices, from assessing the impact of physical equipment to evaluating services and territorial estimates.
_](img/Pasted image 20251019184547.png)
Environnmental footprint of a hardware equipment
Activity: Database exploration (10 minutes)
Go to Boavizta's database and look for the environmental impacts
of digital equipment during the manufacturing and use phases.
Exemples
Here are some examples of environmental assessments of equipment :
Environnmental footprint of a service
Activity: The carbon footprint of an e-mail (30 mins)
You are a consultant specializing in the environmental impact assessment of digital technology. The company info2000 has asked you to assess the carbon footprint of their email services over a one-year period in order to understand how to improve the environmental footprint of their digital activities.
End user equipments
The company has 100 employees working 35 hours per week with five weeks of paid vacation, based in France, each with a laptop on which they perform all their tasks. Employees spend an average of one hour per day sending or receiving emails, which management considers to be their most important activity. Their supplier, Dell, provided this PCF (Product Carbon Footprint) sheet.
_](img/Pasted image 20251019190912.png) Product carbon footprint of a Dell Latitude 9520, Link
Product carbon footprint of a Dell Latitude 9520, Link
Network
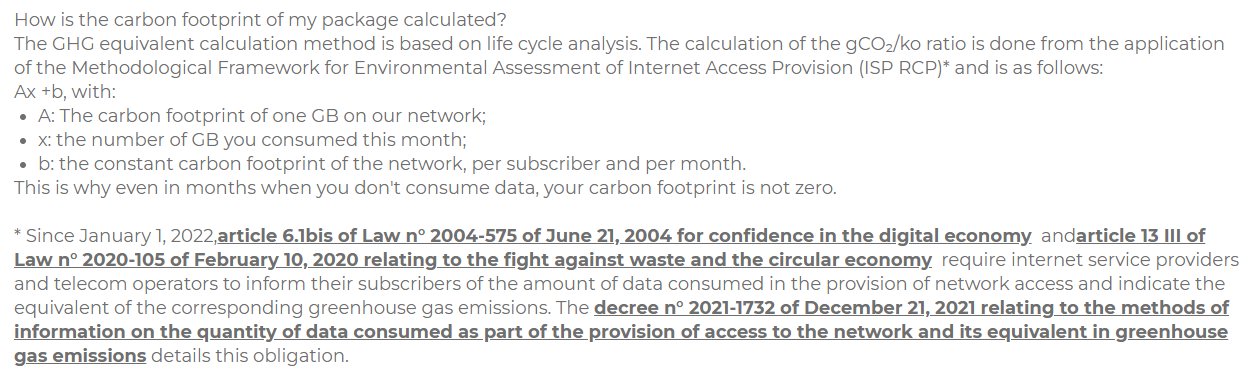
The email service uses 100 GB of the 1,000 GB used annually by the company via the fiber network. Your provider, FreePro, provides you with the following regulatory method:
 Mon Empreinte carbone, Free, https://mobile.free.fr/account/v2/empreinte-carbone
With the following data:
- A = 0.001 kgCO2eq./GB
- b = 20 kgCO2eq./subscriber
Datacenter
The company's service provider is Caramail, which has a data center in France. 10% of its revenue comes from info2000, but info2000 uses 20% of the infrastructure's capacity. The data center consumes 10 MWh annually. However, it has signed a contract (Power Purchase Agreement - PPA) with a solar power plant in India from which it purchases 100% of its electricity, which is why it reports an environmental footprint of 0 to its customers.
For simplicity, you only need to consider the impact of the data centre's use phase (i.e. don't consider the impact of acquiring raw materials, manufacturing, distribution or end of life).
Other elements
- The average carbon footprint in France per MWh is 50 kg CO₂eq.
- You do not have to use all of the elements presented in the instructions.
- Calculate the impact separately for laptops, the network and the data centre.
- There are no right or wrong answers, as long as you justify your choices.
Exemples
Here are some examples of environmental assessments I have conducted:
- LCA of paper based vs. digital based commercials
- LCA of Tribal: a messaging app.
- LCA of Irocco, an email service provider
Territorial estimates
Global estimates
So far, most global assessments of the direct environmental effects of ICT have focused on electricity consumption and greenhouse gas (GHG) emissions – also called carbon footprint – leaving out other major effects such as material or water footprint, but also pollutions. The most prominent publications are: Andrae & Edler (2015, 2020), Malmodin & Lunden (2018), Belkhir & Elmeligi (2018) and Freitag et al. (2021). Carbon footprint estimates and projections are computed using a mix of top-down views based on global numbers (worldwide data traffic, hardware shipments, etc.) and bottom-up estimates obtained mostly using life cycle assessments (LCAs). By unifying the scopes considered in the main global estimates, Freitag et al. argued that GHG emissions from the ICT sector ranged from 2.1 to 3.9% of global emissions in 2020 (1.2 to 2.2 GtCO2e). This wide range is explained by different assumptions about the evolution of energy efficiency and ICT decarbonization, but also by the uncertainty surrounding used data sets due to the obfuscation of large parts of the ICT sector’s production and supply chains.
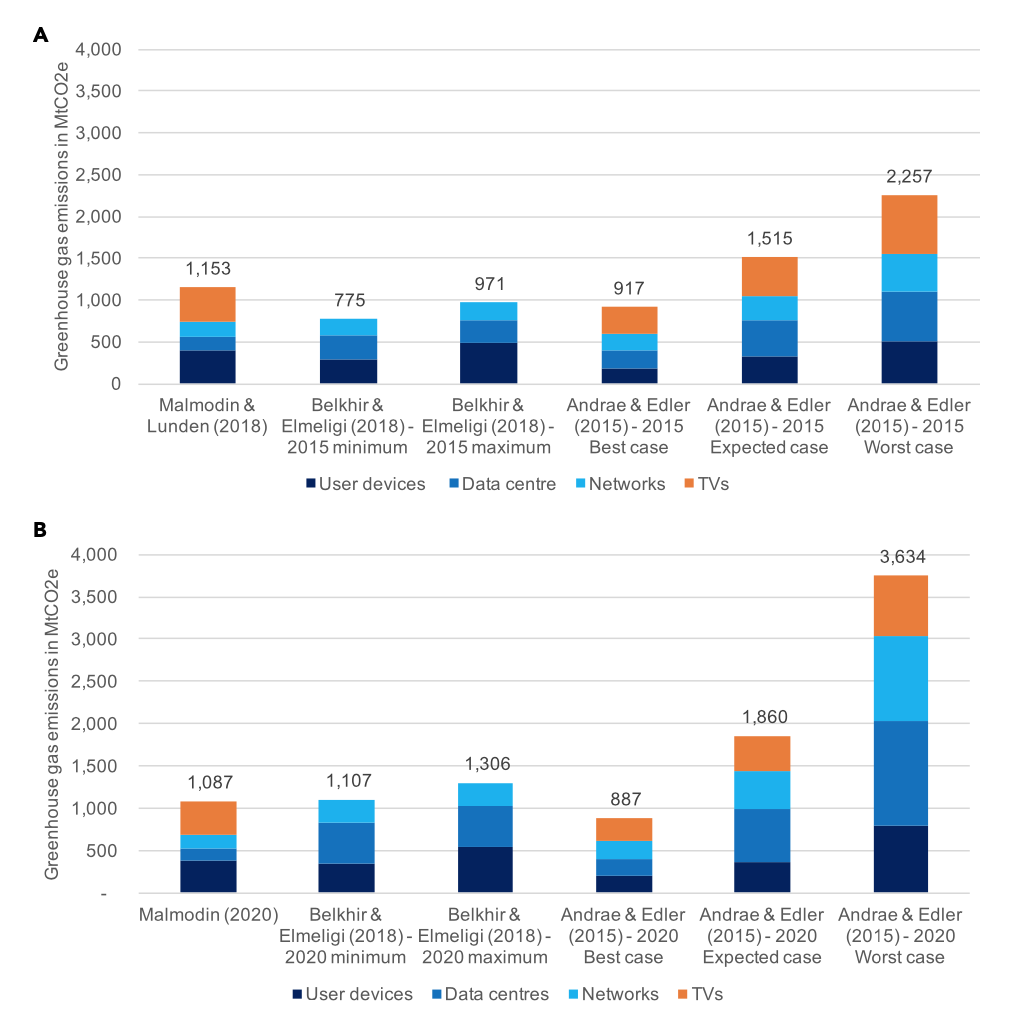
Summary of global estimates in 2015(a) and 2020 (b) - Credits: Freitag et al., 2021
There is a lack of agreement about which technologies ought to be included in calculations of ICT’s GHG emissions—particularly TV. All studies include data centers, net- works, and user devices as the three main components of ICT, but there are pronounced differences of opinion regarding the proportional impact of each. A comparison of the different pro- portions in 2020 estimates (excluding TV) is provided below (Freitag et al. 2021)
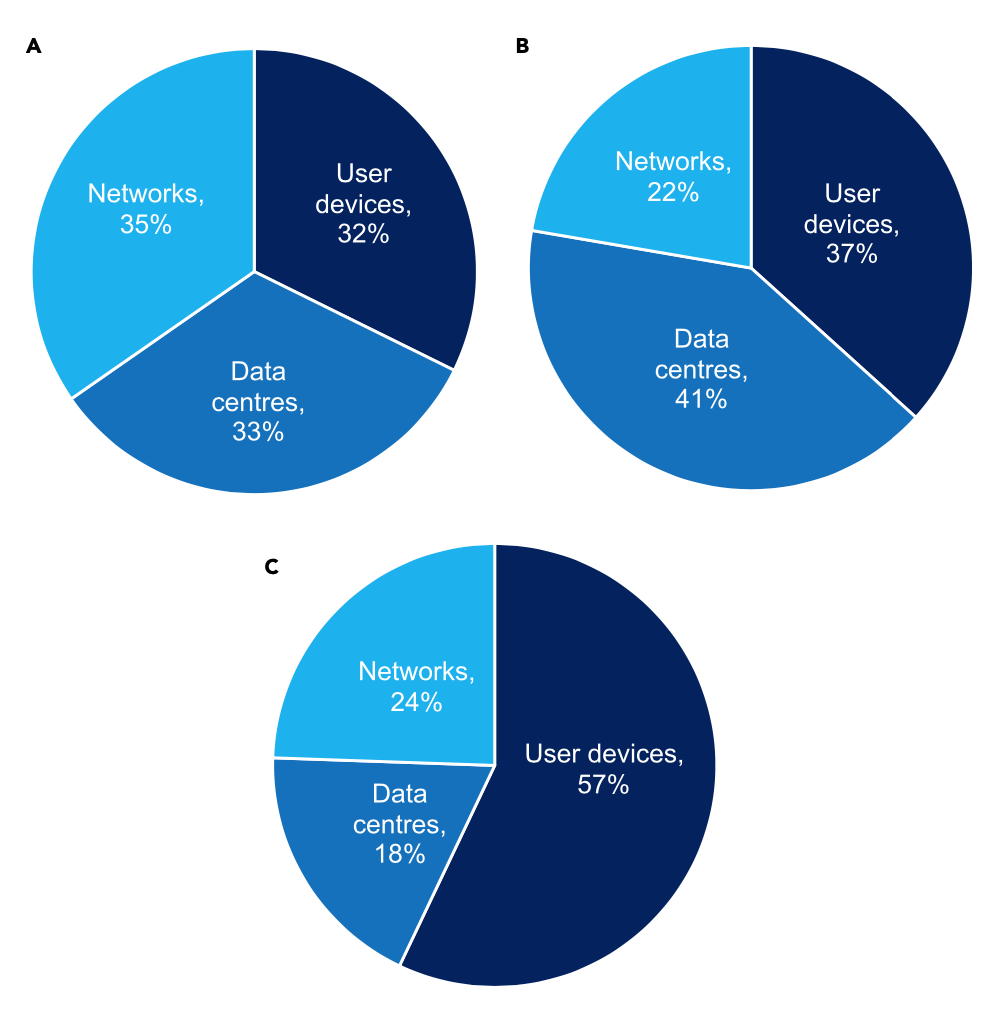
Proportional breakdown of ICT’s carbon footprint, excluding TV (A) Andrae and Edler (2015): 2020 best case (total of 623 MtCO2e), (B) Belkhir and Elmeligi (2018): 2020 average (total of 1,207 MtCO2e), (C). Malmodin (2020): 2020 estimate (total of 690 MtCO2e) - Credits: Freitag et al., 2021
In UE (2020)
Total electricity consumption for digital services in Europe is 283 TWh out of a total of 3,054 TWh6, which means that electricity consumption for digital services during the use phase accounts for 9.3% of European electricity consumption. Total GHG emissions for digital services in Europe are 185 Mt CO2 eq. out of a total of 4,378 Mt CO2 eq.7, which means that GHG emissions from digital services account for 4.2% of European GHG emissions. (GreenIT, Digital Technologies in Europe: an environmental life cycle approach, pp. 8-9)
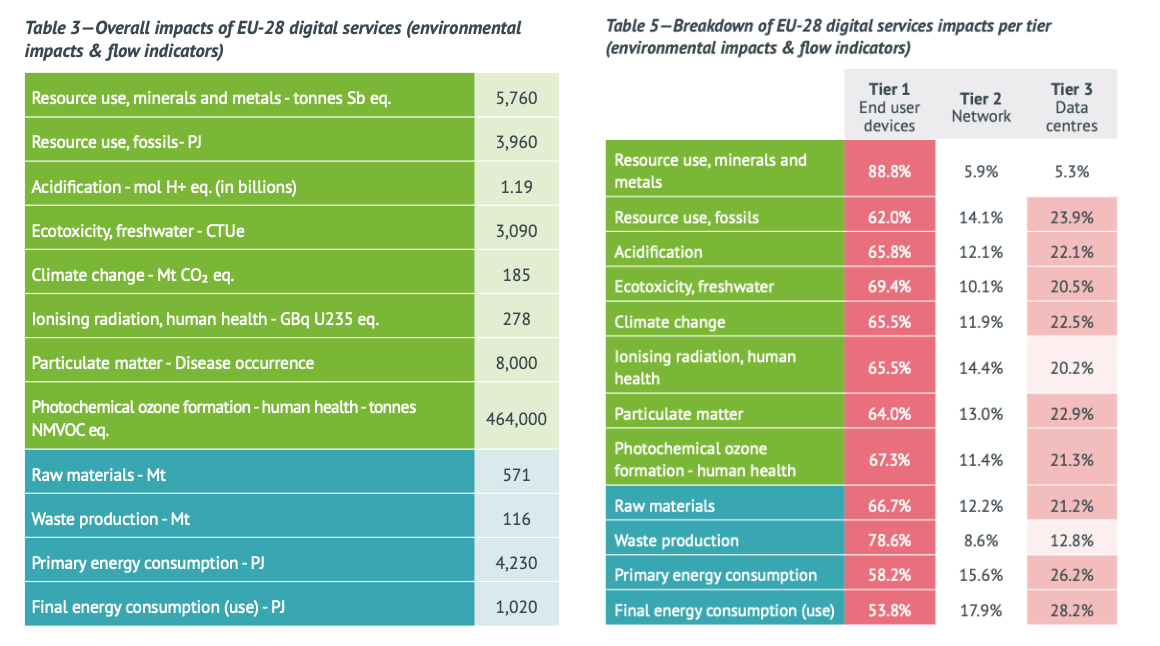
Overall impacts and breakdown per tier of ICT services in UE - Credits: Bordage et al. 2021
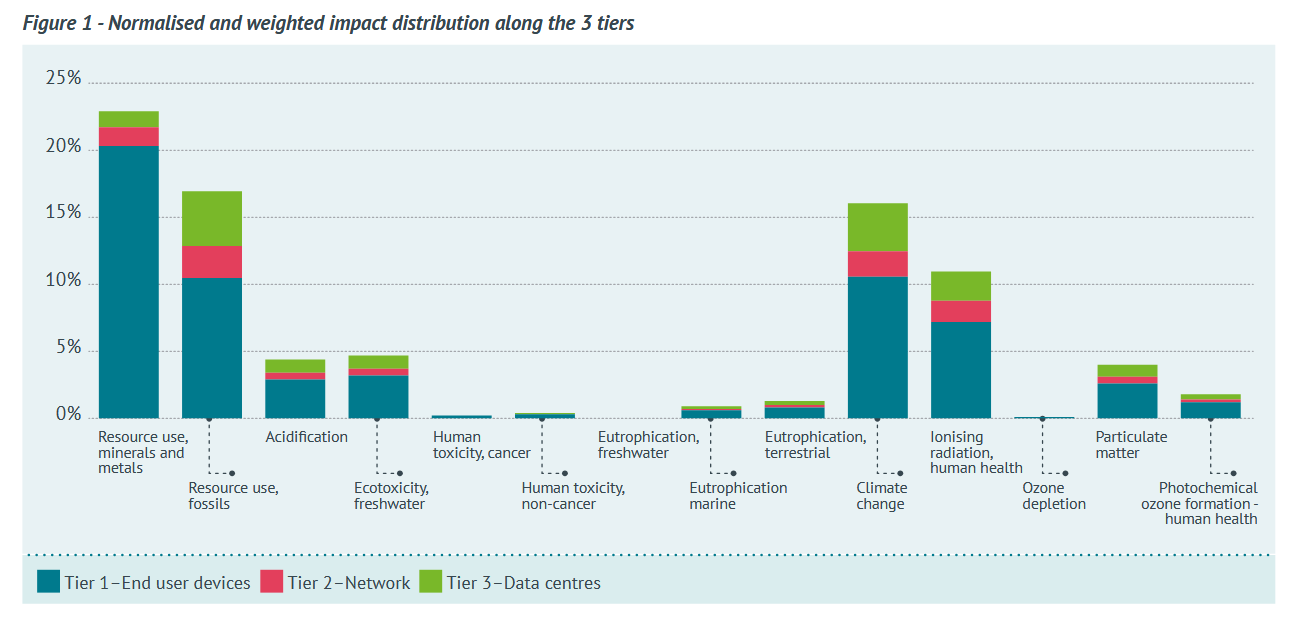 Normalised and weighted impacts and breakdown per tier of ICT services in UE - Credits: Bordage et al. 2021
In France
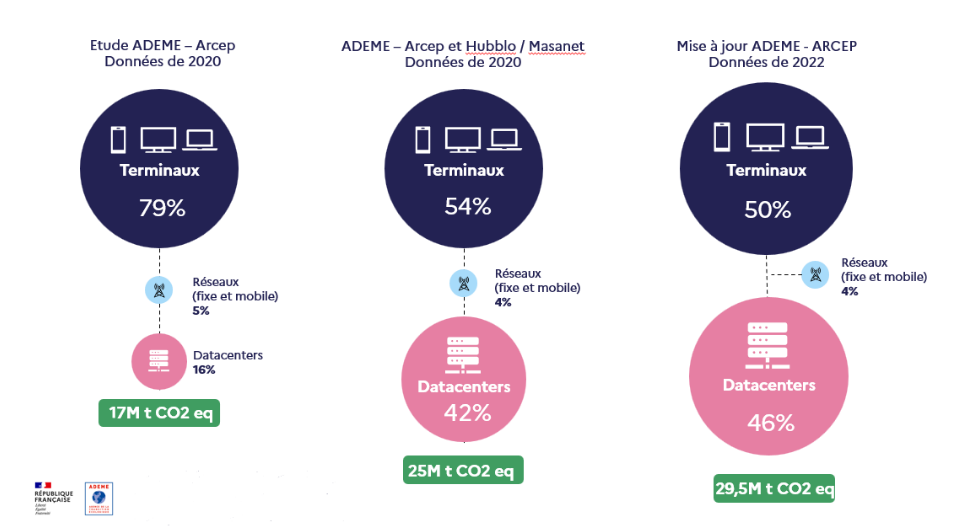
The ADEME-Arcep study assessing the environmental impact of digital technology in France, published in 2022, estimates emissions linked to this sector at 17.2 million tons of CO2 equivalent, or 2.5% of France's emissions in 2020. However, this study had a significant limitation in that it did not take into account data centers located abroad that host French users. In addition, various studies on digital technology have since been carried out, making it possible to update or refine the environmental assessment of certain digital components, particularly telecommunications networks and audiovisual uses.
This document therefore aims to incorporate these various elements in order to assess the environmental footprint of digital technology in France in 2022, and presents three main updates compared to the ADEME-Arcep study for 2020: the inclusion of data centers located abroad, the update of the distribution of televisions (in favor of larger OLED screens, which have a greater impact), and the integration of the results of the study on the footprint of internet access provision in France.
Future trends
It is agreed that low-carbon transition operational scenarios should not be projected more than ten years ahead, as there are too many uncertainties regarding, among other things, the evolution of climate conditions or the evolution of the price of low-carbon technologies. The same applies to the digital sector, where it is difficult to predict the future equipment and efficiency of the equipment, or the emergence of new uses that are not yet known. Thus, Andrae and Malmodin project their estimates up to 2030. For some unknown reason, Belkhir projects his results to 2040, but the uncertainty, both climate-wise and technology-wise, in twenty years’ time disqualifies this estimate from the outset.
This uncertainty leads to a second methodological point: it is extremely risky to project the evolution of the sector based on historical data. As mentioned earlier, digital equipment and services are rapidly becoming more efficient at the moment, so it is not possible to estimate that their past footprint will evolve consistently. This goes in two directions: the relative power consumption (kWh or J / per operation) of a piece of equipment tends to decrease over time and does not remain constant over time. On the other hand, more complex or more efficient equipment can lead to an increase in the material footprint (manufacturing impacts). There are of course all the new uses that are not yet well modelled from an environmental point of view: AI, machine learning, IoT, blockchain, VR/AR, cloud gaming (Google Stadia, etc), etc.
Andrae estimates that the digital sector will account for 1,500 to 3,200 TWh of electricity consumption and 1,269 MtCO2e of emissions by 2030 (Freitag et al., 2021). Other researchers haven't proposed other estimates yet, but some expect that efficiency gains and substitution would allow the carbon footprint of the digital sector could be halved by 2030.
Charlotte Freitag's Lancaster team has summarised the various hypotheses in the scientific literature that may change the environmental footprint of the sector in the years to come:
- Efficiency gains continue steadily ;
- Renewable energy is increasingly replacing fossil fuels in the mix of large digital companies;
- Slowing efficiency gains reduce the growth of the sector and thus the growth of its emissions ;
- Activation effects of digitalization (enablement effect) reduce the overall emissions of other sectors ;
- Increasing mutualisation of IT infrastructure (hyperscale, etc.) ;
- Market saturation in terms of facilities and services ;
- Reducing the weight of new equipment.
Among the assumptions that consider negative trends in the digital sector :
- Exponential growth of data is increasing the energy consumption of networks and data centres (growing infrastructure) despite efficiency gains ;
- Emergence of new equipment-intensive (IoT) and data-intensive (cloud gaming, etc.) services ;
- Efficiency gains are slowing down ;
- Rebound effects counterbalance efficiency gains at the aggregate level ;
- Efficiency gains through digitalization support the development of the sector and therefore its footprint ;
- Efficiency gains from digitalization increase the economic activity of other sectors and thus their environmental footprint ;
- Increasing the material intensity of new equipment.
In an unprecedented foresight exercise, the French Agency for Ecological Transition and the French Telecoms Regulator have attempted to project the environmental footprint of the digital sector in France in 2023 and 2050 using 4 scenarios. Estimates for 2050 are not recommended, but the median scenario for 2030 projects a 45% increase in the carbon footprint in 10 years.
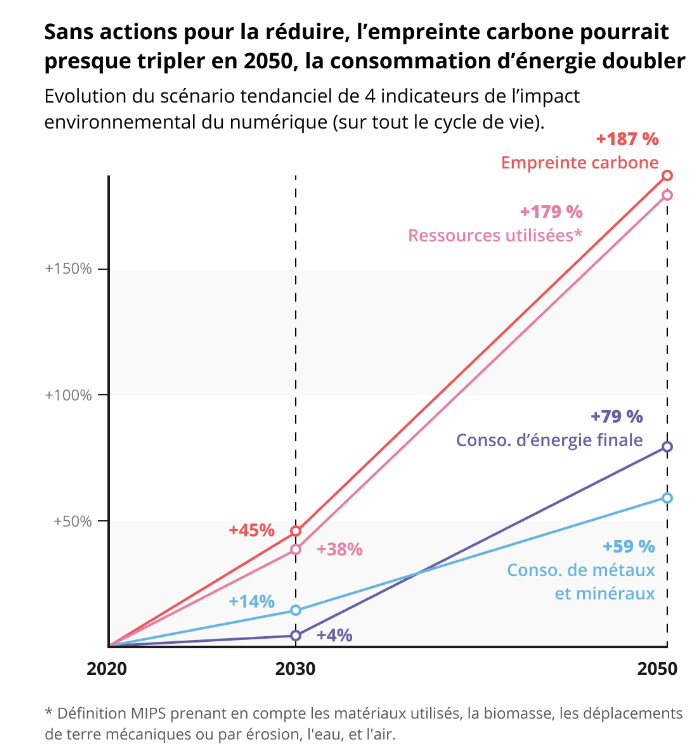
Trends in 4 indicators of the environmental impact of the digital sector. - Credits: Lees Perasso et al. 2022
Moving forward in the dark
Environmental assessment is a challenging exercise, particularly in the digital sector. It faces a lack of transparency from industry players, significant uncertainty and accounting issues that are the subject of technical but also political debate.
During the last six sessions, we have discussed material dynamics of the ICT sector and the associated environmental issues. It seems more important to understand these than to try to find exact environmental footprint figures. For now, all the evidence suggests that the footprint is increasing year on year, albeit not at the exponential rate predicted by some researchers. However, the development of AI systems could lead to exponential growth; it is still too early to tell.
Resources
Syllabus
- Gauthier Roussilhe et al., A long road ahead: a review of the state of knowledge of the environmental effects of digitization, 2023
- Charlotte Freitag et al., The real climate and transformative impact of ICT: A critique of estimates, trends, and regulations, 2021 (Summary + Introduction)
To go further
- Frederic Bordage et al., Digital technologies in Europe: an environmental life cycle approach, 2021
- Etienne Lees Perasso et al., Evaluation de l'impact environnemental du numérique en France et analyse prospective, 2022
- Udit Gupta et al., Chasing Carbon: The Elusive Environmental Footprint of Computing, 2021
- Steffen Lange et al., Digitalization and energy consumption. Does ICT reduce energy demand?, 2020